Progress, Monitoring, & Plans
Problem
How might we create a tool that integrates all existing student learning plans onto the Otus platform?
At our core, Otus’s mission is to bring together the chaos of disconnected tools used every day in the classroom. We want to empower our educators with the power of data so that they can see exactly how their students are learning. Though we have had success in bringing together lessons, assessments, grade books, resources, portfolios, and blogs, truly personalized learning can be taken a step further.
To truly create unique learning opportunities for students, schools often create individual learning plans that they place students into. Once on a plan, teachers can set goals with their students and make sure they are progressing towards achieving those goals. The problem, however, is that most educational institutions track student progress on these plans through a disjointed system of tracking. Separate docs, spreadsheets, and worksheets might all contain valuable data on how a student is progressing through a plan. This is where we saw an opportunity to design and build a brand new product that can truly make Otus the only source for student data.
Hypothesis
We believe that designing a tool flexible enough to handle the integration of several different types of student plans will result in the adoption of Otus Plans as the chosen medium for logging and tracking student progress, because we know the benefits of easy and accessible methods for tracking student growth.
Planning
The Design Team at Otus has always worked closely with our Development team within the Agile development process. We believed that the best way for our Product Managers and Program Managers to successfully plan development and create epics and sprints was for Design to deliver all deliverables at once. This sometimes meant that for large projects we were handing off over 100 individual mockups.
Over the years, however, we have learned that while these large design deliverables were comprehensive, we would often hit roadblocks during development. Technical restrictions would emerge causing delays in development, and the designer would be forced to re-enter the maze of mockups to rapidly make changes so development could still hit its due date.
To combat these previous struggles, we decided to approach the design and development of plans differently. Early collaboration between UX Research, Product Design, Product Management, and Engineering would be extremely important. Early input from our developers helped us form an extremely detailed outline for how Plans would work and assisted in informing the designer of technical limitations that might impact how components would look and function.
A small section of our original user flow. Each “swim lane” represents a different persona.
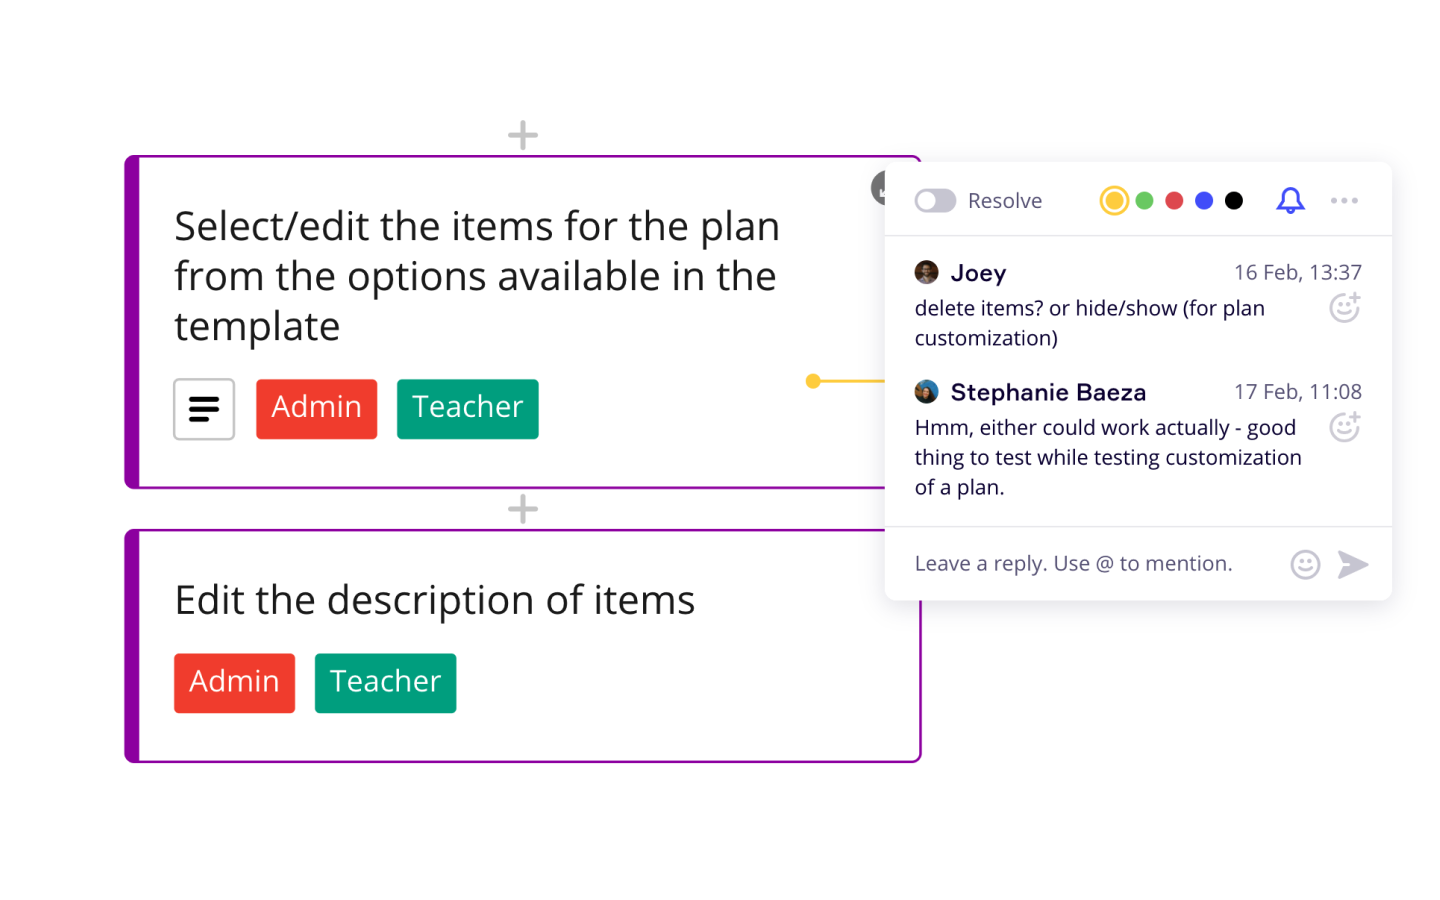
The example above is a small section of a Miro board that was created during this early collaborative process. Our UX Researcher first collected detailed information about how our educators create and use plans outside of Otus. UX Research then got together with our product managers to create a detailed user flow for the entirety of Plans. Now, both Design and Development were able to see a birds-eye view of what this project would look like before any work had been done on it. Collaboration and conversation were welcomed at this point, as seen in the example below.
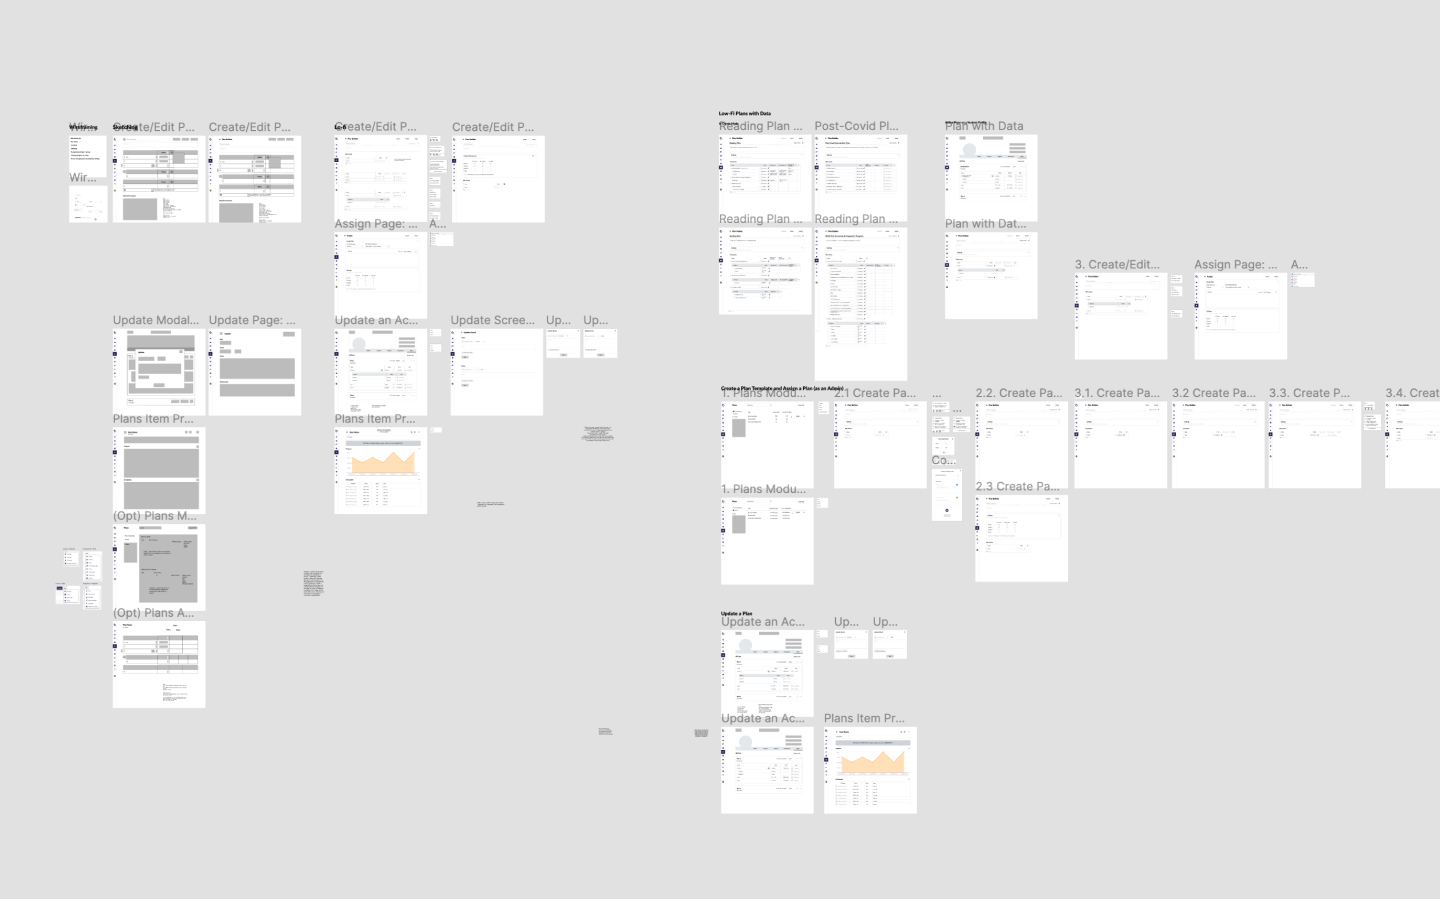
Based on the resulting product map that came from this stage, our UX Researcher was then able to create a series of wireframes to roughly sketch out the user experience. These were purposely kept low-fidelity, and included several areas with undefined or redesigned areas to be addressed or discussed in the future. Though low-fidelity, however, these wireframes were extremely important for both engineering and product to see the product map that was built Miro come to life and gain more of a deeper understanding of what Plan would look like and what would be needed.
Creating a Dynamic, Customizable Platform for Plan Creation
When conducting our research on Plans, we realized that every district builds and manages student plans differently. This meant that it was up to us to design a way to build Plans that were universal in its ability to recreate existing Plans that some districts may have been using for several years. As seen below, one of our clients shared an example of a Plan they have been using with their students. It shows the diverse set of needs that our Plan Creation tool would require.
Example of a Plan given to our UX Researcher.
This example showed us that we needed Plan Creation to have several different features:
A fully customizable table
Plans can take a variety of different forms. To create a tool that allows for educators to fully build customizable Plans that fit the standards and organizational rules for their districts, they will need the ability to add as many columns and rows as they need.“Status” columns
The most important pieces of information that will be gained from a Plantable like in the example above are the cells that display student progress on a plan. We need to allow educators to create a unique column dedicated to updating the status of a student on a given goal. For example, Mr. Bueller sees that Cameron is progressing well on his goal of multiplication tables, and needs to update Cameron’s status from Not at Mastery to Approaching Mastery.“Date” and “Text” columns
In addition to columns that are dedicated to updating the status of certain goals in a plan, other types of columns are needed. Through researching Plans that our clients shared with us, we found a need to add specific column types for logging dates and a column for writing detailed notes about student updates.Hidden rows
Like in the example above, some rows in Plan tables might be used to organize different grade levels. To account for this, we needed to create a way for our educators to customize these tables, to hide certain rows for specific students. If a student is being added to a plan that has several rows for different grade levels, for example, the only row that needs to be seen by the educator is the one belonging to the student’s grade level.
With these requirements in place, we now needed to craft an experience that makes it easy and simple to create complex student plans, applicable to our wide variety of school districts.
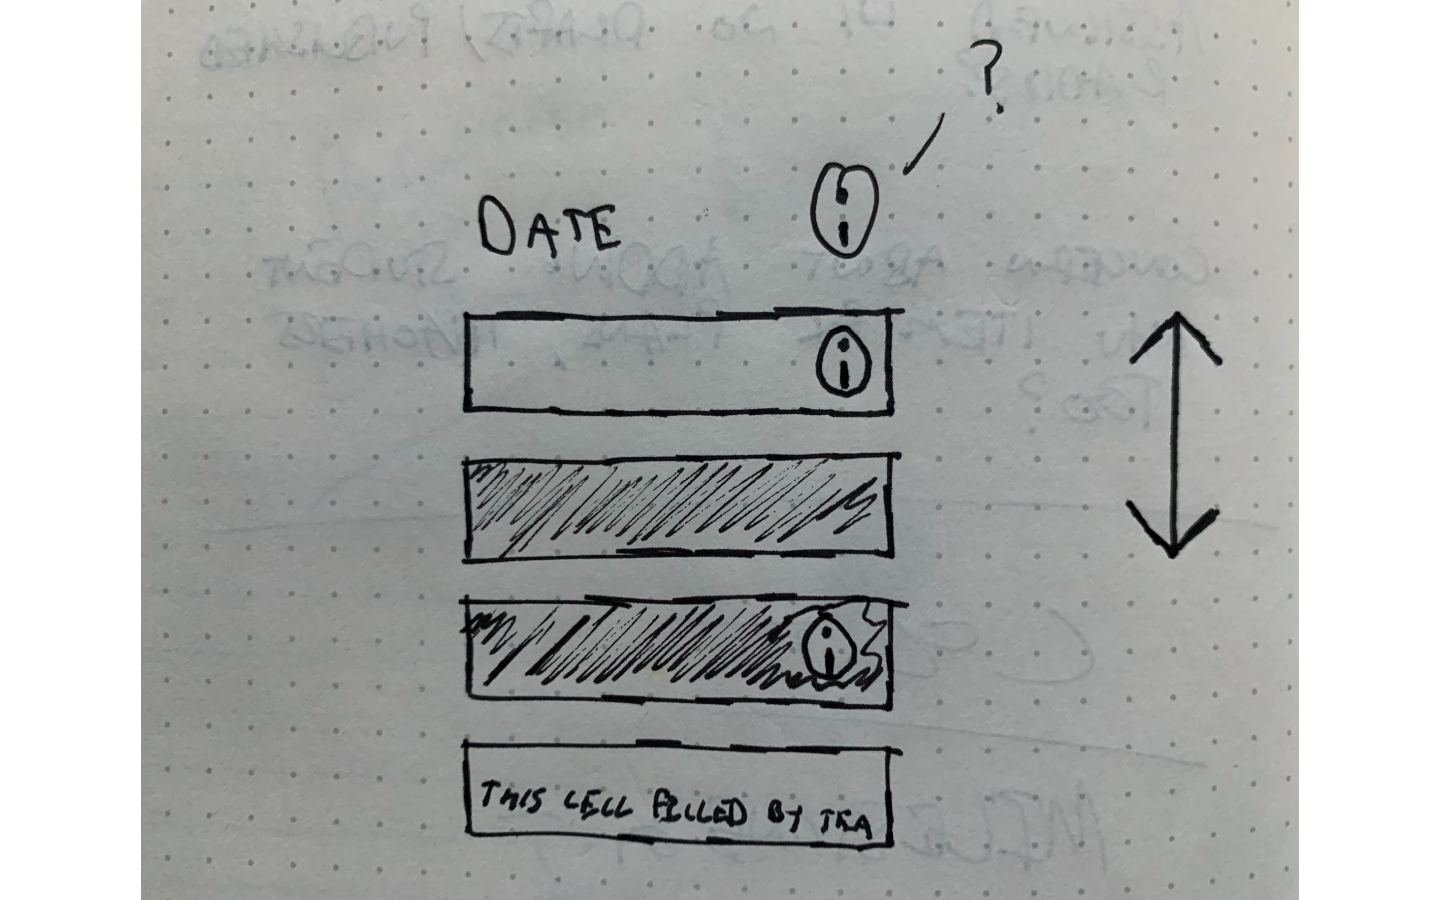
When administrators create Plans, they are typically using a spreadsheet, or are creating a table on a Google Doc or Word Doc. We wanted to begin with a similar starting point in Otus, but streamline the creation of new columns and rows. However, some cells in a Plan table will need to be placeholders. An example of this is if a Date column is added to a plan. Educators will add dates as they update plans for students in real-time, but aren’t necessary when creating a Plan. Because of this, we needed a way to signify to our users that some table cells don’t need any information inside of them.
An early sketch of what an early sketch of what inactive placeholder cells would look like. Our focus here was brainstorming ways to communicate to the user that the column is read-only.
We also explored new ways of highlighting the significance of Plan Items, or what educators would refer to as “Goals” or “Milestones”. Keeping this organized in our user interface was very important, as we wanted the experience of building a plan to be as clean and clear-cut as possible. We explored several varieties of tables to create new plans, seen below.
In these examples, we focused on organizing these tables by the Item Row to visually communicate the Plan layout in a cleaner and less complex manner. Through our iterations of this table, however, we learned that a more traditional table format might feel more comfortable for Plan authors. Because of this, we expanded on our traditional table component to add new features like adding and removing columns and rows and editing inside each cell.
3 examples of table iterations, focusing on the differences in column types and how to signify editable cells.
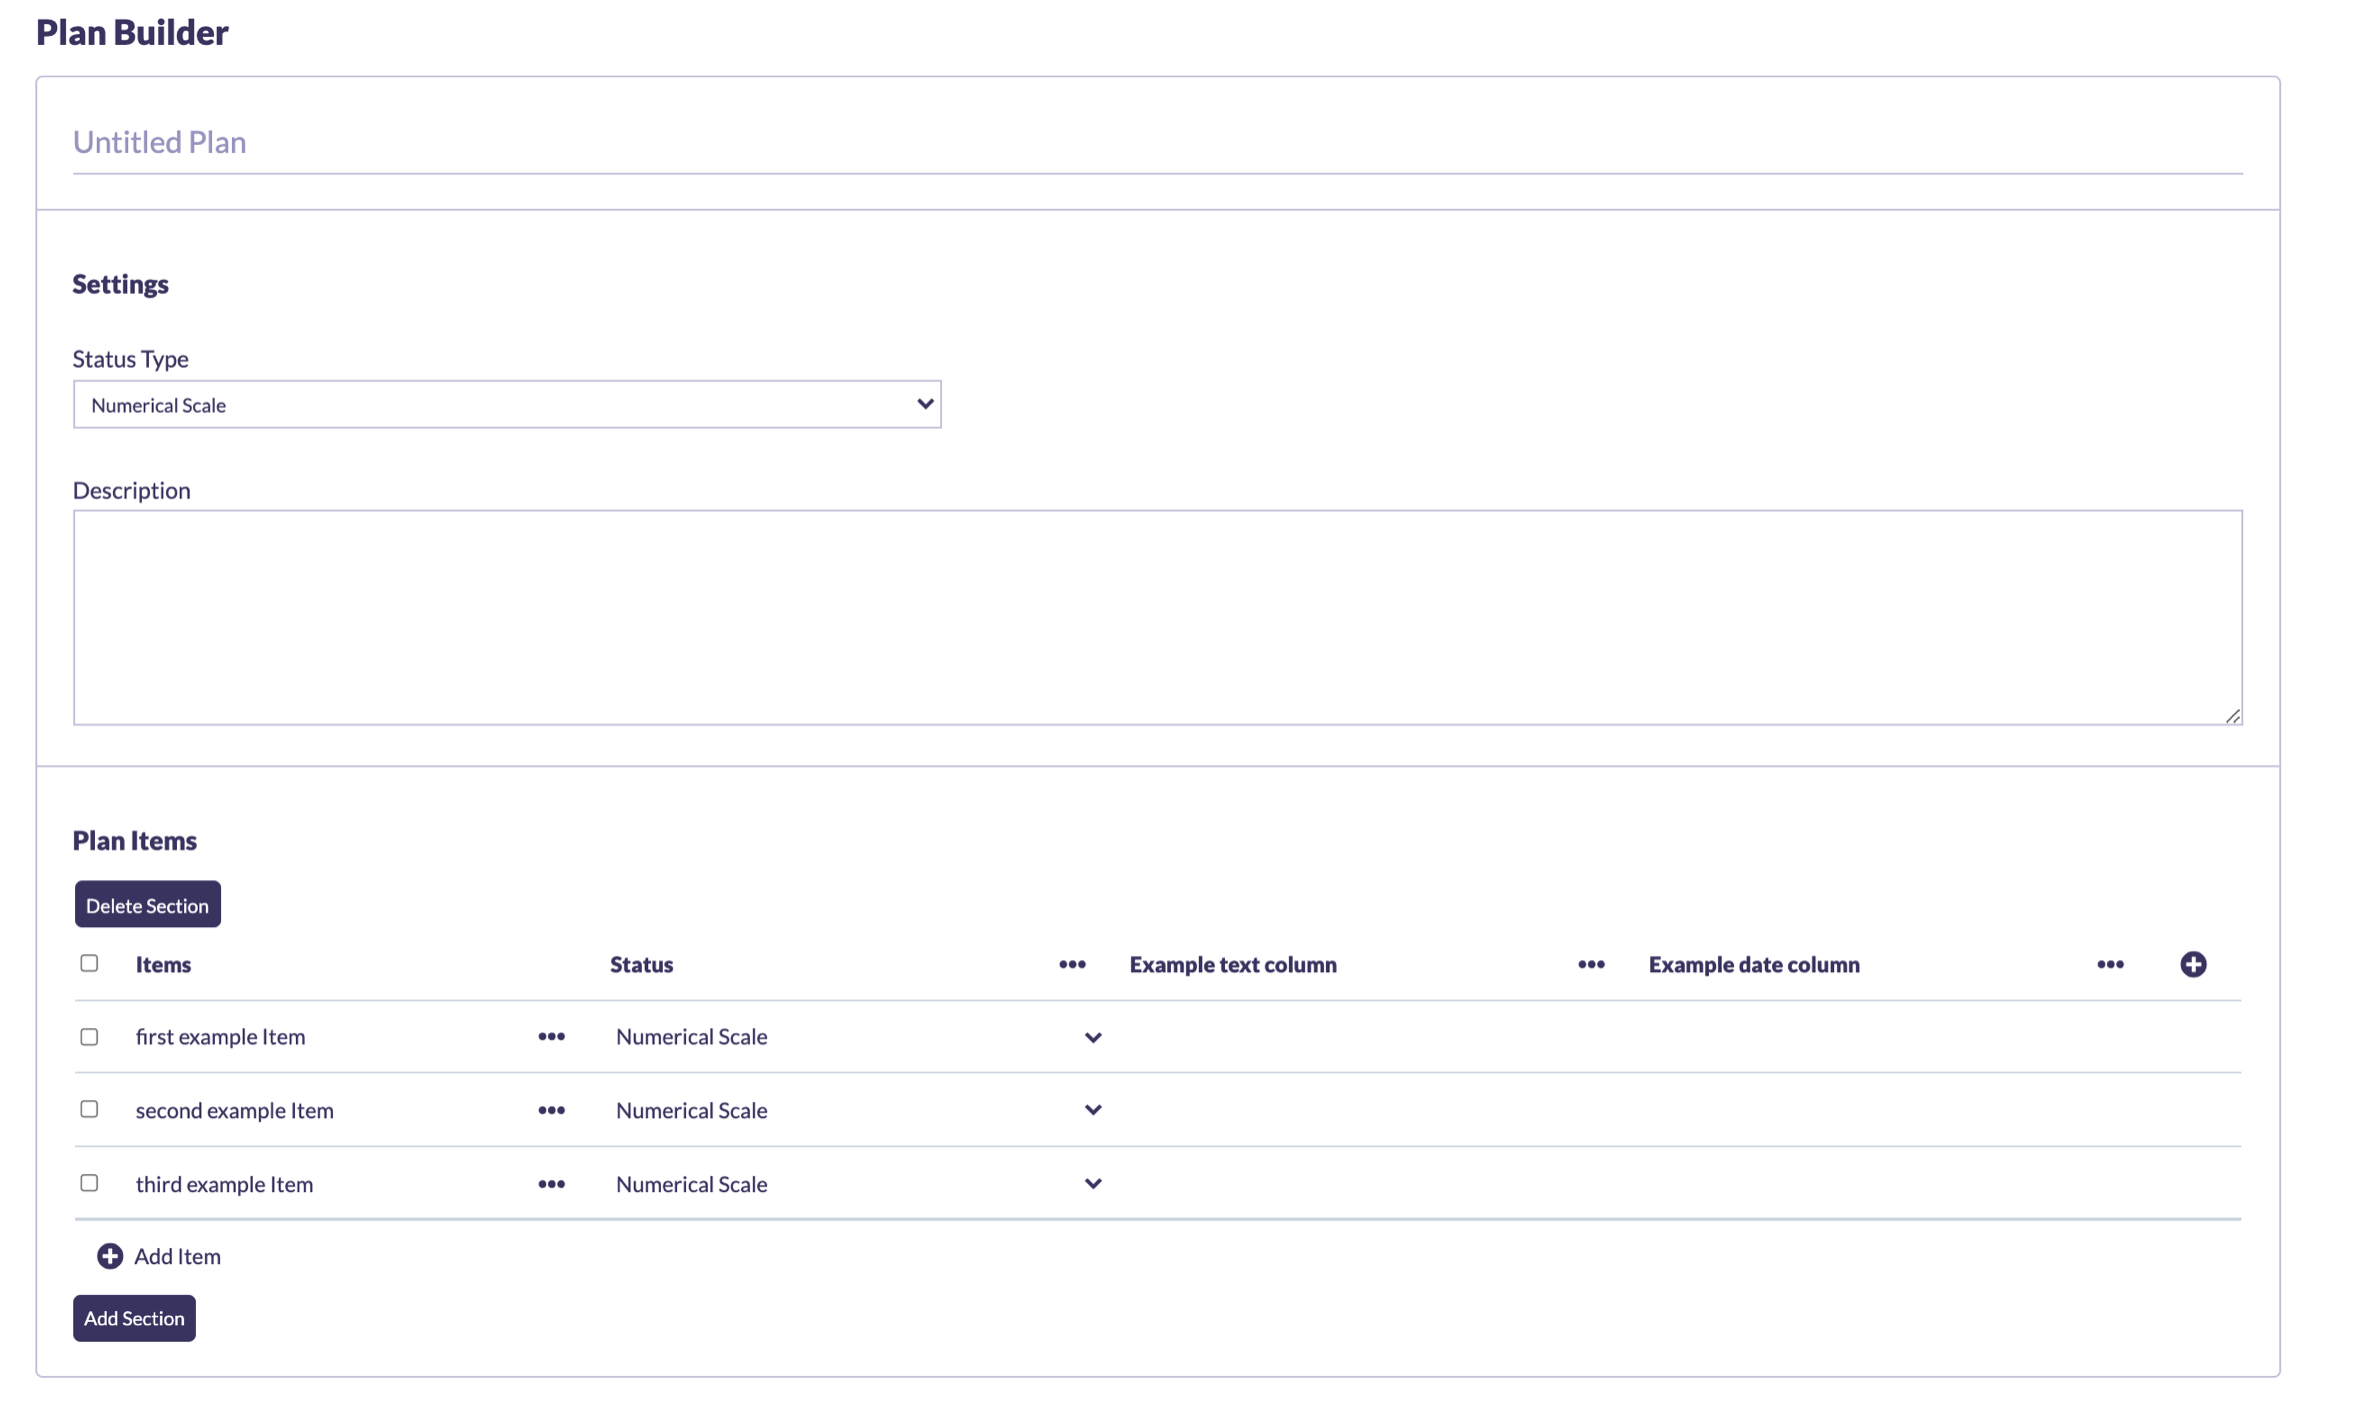
The final layout of the plan creation table used different shades of gray to communicate which cells are and are not editable and informational text to help communicate this. We also added information icons to help communicate to the user which cells will be used by educators when updating a plan (dates and text).
Rapid Prototyping & Testing
As the Plan Creation Table was being designed, we were consistently meeting with the lead Front-End Developers on its progress. Based on early iterations of the table, they were able to quickly create a framework for the new table component, and only after a few weeks were able to make a functioning prototype. As the last design changes were being made to the table, the coded prototype was also tweaked to perfectly match both versions.
Using the coded prototype, we were then able to immediately test the table's functionality and other customizations and tools designed to create plans. Though this prototype was not linked to any back-end, the behavior of the table mimicked the final version, thus allowing us to rigorously test it with our stakeholders.
The Plan Creation Table prototype, used in testing with various stakeholders.
When we recruited district administrators to test the prototype, we asked them to attempt to recreate their existing plans. Overall, this task proved to be successful in that every admin that tested the prototype was able to recreate their existing Plan in Otus, but we also gained some insight as to their process in attempting to do so. Our UX Researcher reported this in an excerpt below:
“Some admin may think very literally when creating their templates, trying to recreate exactly what their current tools look like. However, to create their plan, they will need to be able to distill what they want to track and how they would like their staff to track it in order to adapt to the structure. Participants were most successful when they took this approach.”
This is a situation that we see a lot at Otus. Many districts are used to creating content (assessments, lessons, etc) using a specific set of tools that are familiar to them at the time, and need to adjust their authoring process when adapting to a new tool like Otus. This learning curve is generally expected by our users, however, as we have come to understand that a tool like Otus should have expected learning curves, especially when transitioning to new software.
However, the most important factor is that the admin was successful in recreating their Plans using the Otus Plan Builder. As said before, we came across Plans that had incredibly different organizations, on a variety of different platforms (Google Docs, CSV’s, printed documents, etc), so it's a challenge for us to create a tool to bring all of these different formats into one. Our preliminary testing gave us the information needed to be confident in our design decisions and led us to continue to heavily develop this complex component.
Key Performance Indicators
To measure the success of this project, we defined a number of KPI’s to measure its success in the months post-release:
>80% adaptation by admin and teacher users in districts with existing plans in the first 6 months.
Consistent or increased weekly logs from educators (plan updates, visits, edits, etc) for 6 months.
>90% positive feedback
Conclusion
At Otus, we love to practice what we preach. Over the years, we have recognized our shortcomings when it came to how our big projects are structured. By using what we have learned, we developed a new process for design and development, and we were able to release a flagship product for our educators.
From a design perspective, we were extremely successful in working side by side with our developers for the entirety of this project. We were able to iterate freely and were never rushed to deliver the completed design deliverables. As Otus moves into the future, we will look to make consistent improvements to Plans based on user feedback, and bring this new style of project management to other new products on the horizon.


